"Which of our posts work best, and what should we do more of?"
It's the most natural question to ask an AI about your social media. It's also a question where the AI can be completely, confidently wrong, and give you recommendations that point in exactly the wrong direction.
It happened to us. Here's how, and the rules we now follow.
The quarter that wasn't
When I first had an agent analyse our YouTube and Instagram performance, the results looked great. One quarter stood out as our strongest by far, with average views per video many times higher than any other quarter. The AI's recommendation: do more of what we did then.
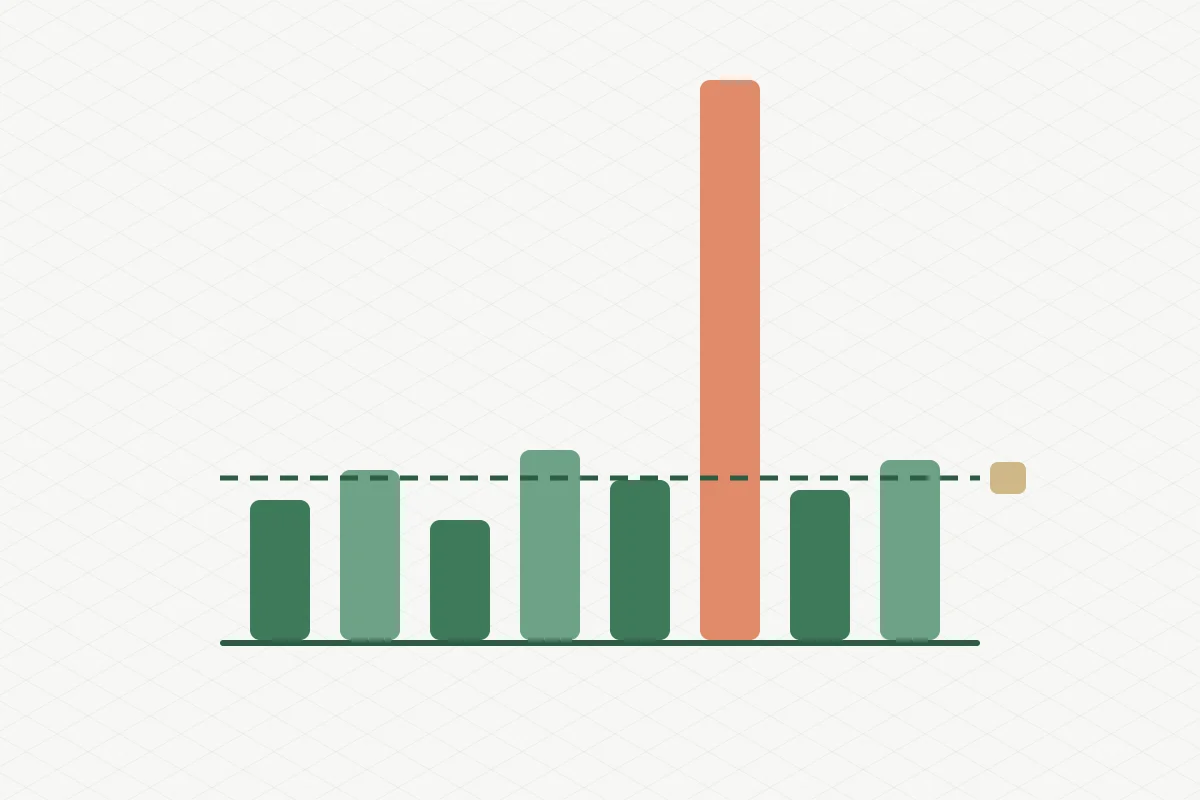
The problem: that quarter included two big campaign films with serious media budget behind them. They weren't "performing". They were paid to be seen. Once we took them out, the average for that quarter dropped by roughly a factor of ten, and it turned out to be our weakest quarter, not our best.
Every recommendation built on the first version would have been wrong. And it would have looked perfectly plausible, with charts and all.
Rule 1: separate paid from organic before you rank anything. Not as a footnote, not as a filter you can optionally apply. As the first step, every time. We now call it our iron rule, and it's written into the analysis instructions so no agent can skip it.
One outlier makes everything else look bad
Even after removing campaigns, we hit a second problem. One promoted video had so many views that, compared with it, every normal video looked tiny. In a ranking based on averages, a regular good video looked more than a hundred times worse than the leader. That's not insight, that's noise.
We switched to medians. The median tells you what a typical post does. It doesn't care about the one post that went viral or got a boost. Suddenly the differences between formats and topics became visible again: which kinds of posts reliably do a bit better, which reliably do a bit worse.
Rule 2: use the median for "typical", and look at outliers separately. Outliers are interesting. They just shouldn't define your baseline.
Not all "engagement" is the same
Different platforms count different things. On one network, the analytics tool's "engagement" included link clicks; on another, it didn't. Put them side by side and one platform looks far more engaging than the others, for purely technical reasons.
Rule 3: compare within a platform, not across platforms, unless you've checked that the numbers mean the same thing.
One metric, three definitions
The same problem exists inside companies. For one of our core business metrics, we found three different definitions in circulation, in three different slide decks. Each one was defensible. Together they meant that every meeting started with a debate about whose number was right.
We fixed it by writing the definition down once, in a single place, and building a small tool that calculates it live from the CRM. Nobody has to agree with the definition forever. But everyone uses the same one until it's changed, in that one place.
Rule 4: every metric has exactly one written definition. Especially when an AI is doing the calculating. It will pick whichever definition it finds first.
Watch the small print
A few more traps we've run into:
- Currencies. Comparing partner revenue across countries against a single threshold made partners in countries with a different currency look many times bigger than they were. Always convert before you compare.
- Auto-replies. "Replied to 95% of messages" can mean "sent an automatic message to 95% of people". Look at how fast the replies came.
- Privacy in the data. Some analytics exports include profile image links with access tokens in them. Strip those before anything gets stored or shown.
Let the AI do the counting, not the thinking
None of this means AI is bad at analytics. It's excellent at the tedious parts: pulling data from APIs, cleaning it, scoring the sentiment of thousands of comments, drafting content ideas that link back to the real posts and comments they came from.
But it has no idea that a post was paid for, that a platform counts differently, or that your business uses a metric in a particular way. It will produce a beautiful, confident report either way.
So the checklist is short:
- Paid out first. Always.
- Medians for the baseline, outliers on their own.
- Compare like with like.
- One definition per metric, written down once.
- Read a few of the top posts yourself before you believe the ranking.
Your best-performing post might really be your best. Just make sure it earned it.



No comments yet